

Progress and metrics
What do Muscle Profile and Body Graph show?
Distinguish weekly volume, the long-term stimulus view, and the performance score.
Check the indicator and period first
The same workout produces analytics that answer different questions. A color or number on one screen is not directly comparable with a score on another. Check the card title, selected period, unit, and data status.
| Indicator | What does it show? | How should it not be interpreted? |
|---|---|---|
| Weekly muscle volume | The weekly contribution of logged sets according to muscle roles | The same number of full sets for every muscle, or a measure of muscle growth |
| Muscle Profile | A volume/stimulus view over the selected completed weeks | Measured muscle size or a strength ranking |
| Body Graph | Displays the muscle profile's volume/stimulus bands on the body | Every color representing a strength level or health outcome |
| GymLogic Score and Form | Assessment of supported current performance against product references | A historical PR or quality of technique |
| Training Load | A load indicator based on session duration and session RPE | Total kilograms lifted |
Why can muscle volume be fractional?
A movement's directly targeted muscle, assisting muscle, and stabilizing role do not contribute equally. The product treats these roles separately; the same physical set does not count as one full set for every muscle. Contributions may therefore appear as decimals. Do not confuse set counts with weight × repetitions alone.
Muscle Profile and Body Graph
On the profile, you can add the Body Map and Hypertrophy Stimulus cards from Add Component.
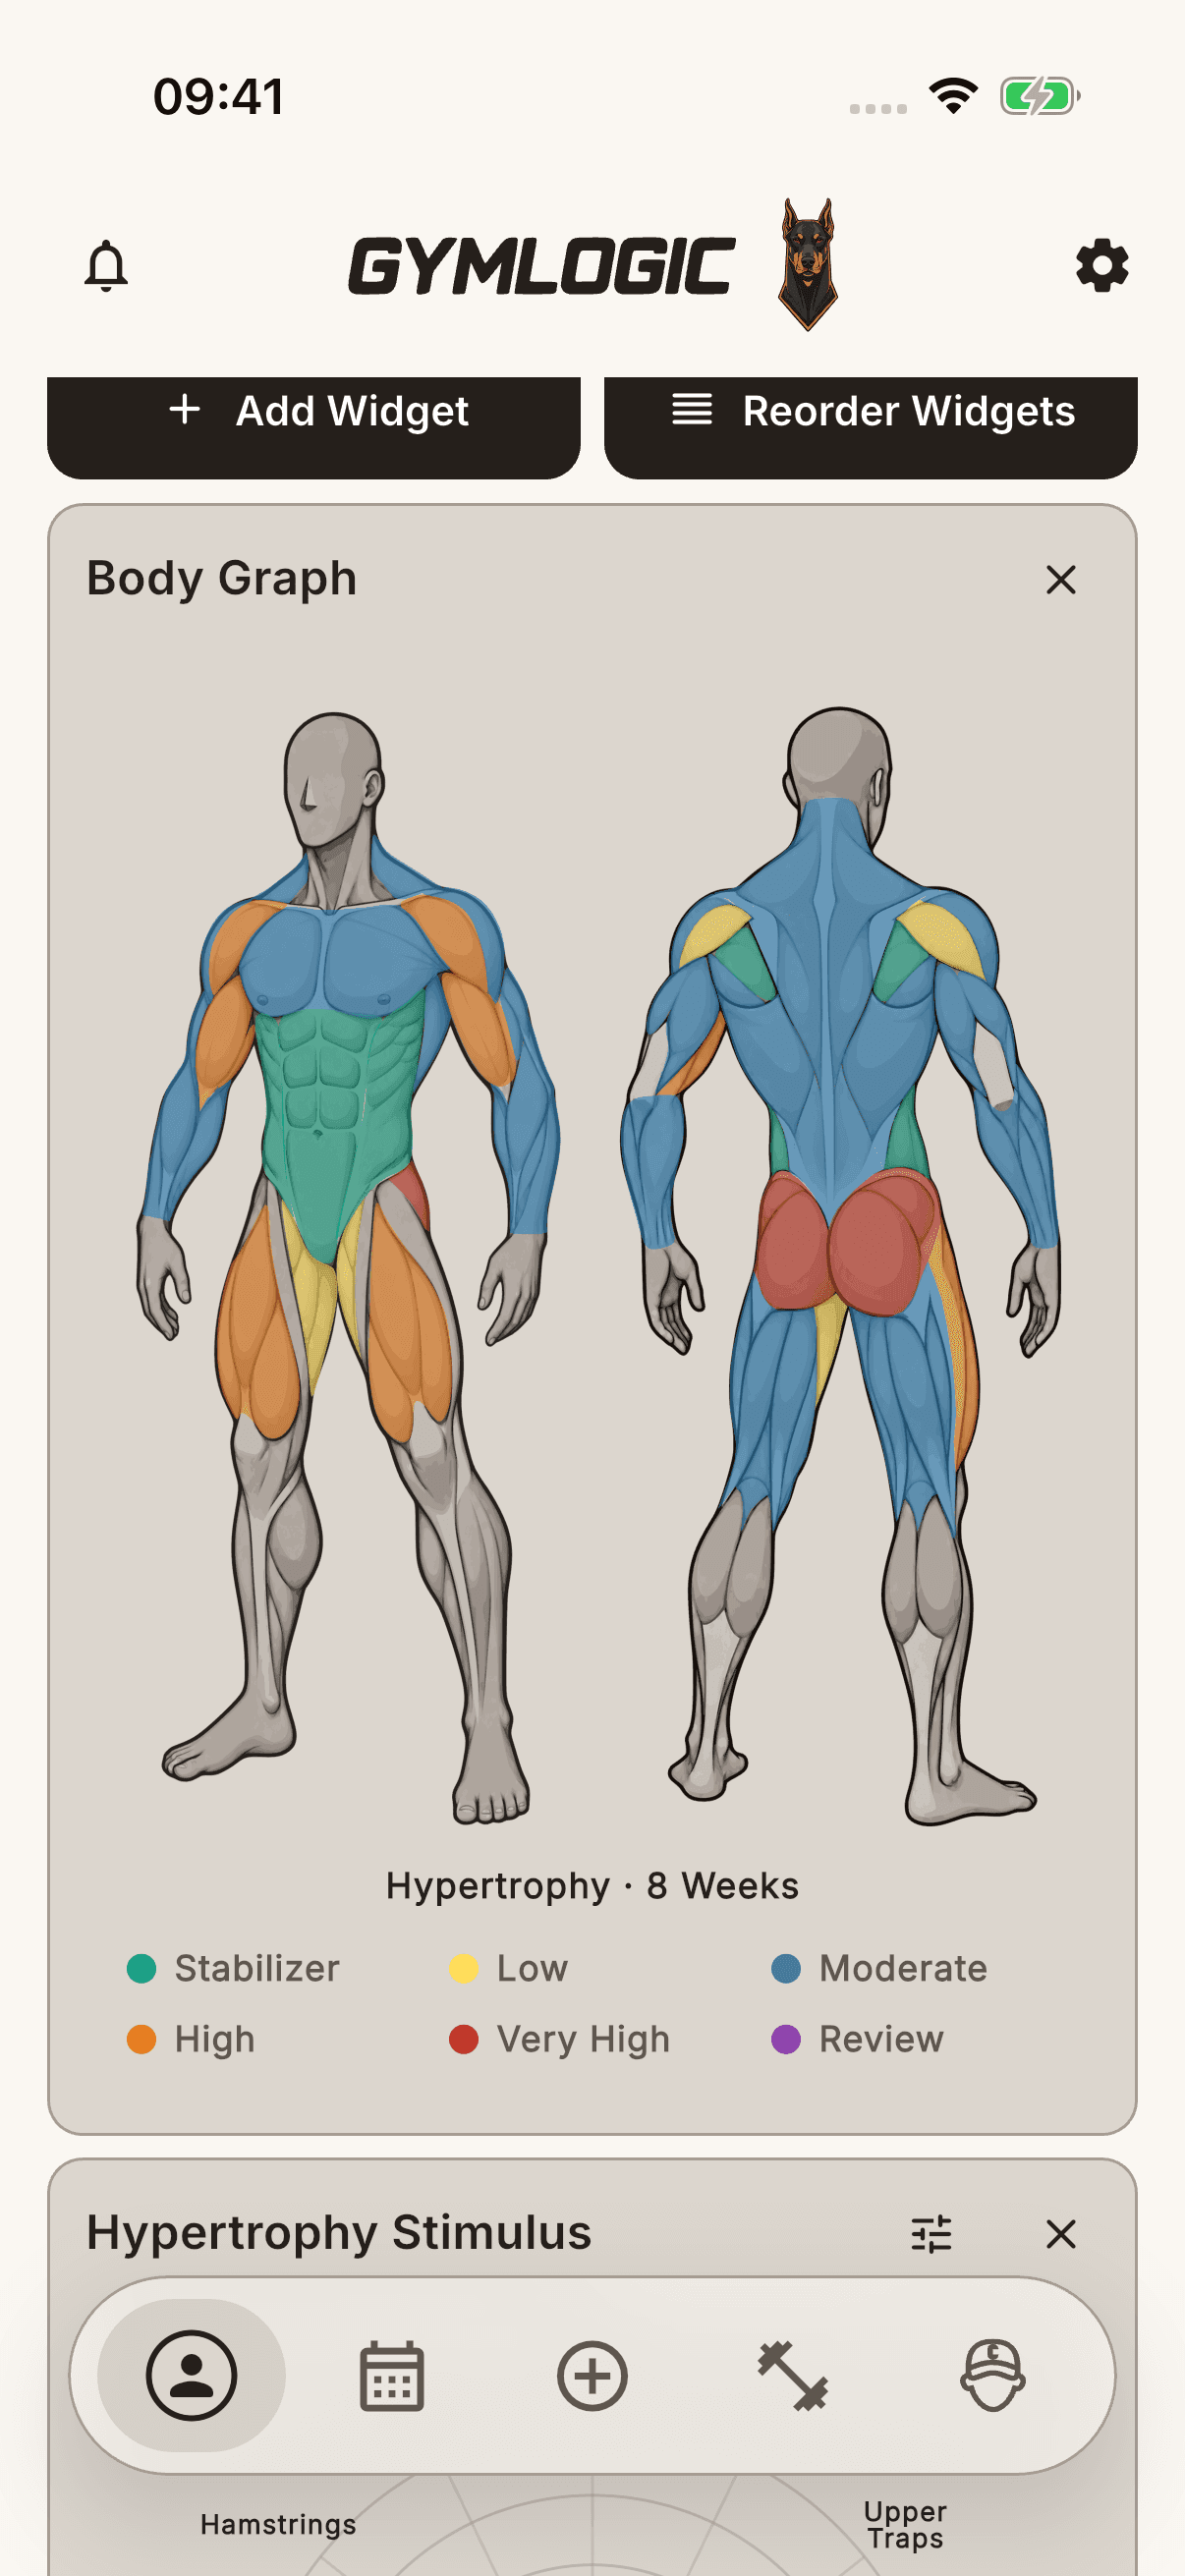
Body Graph is shown on the body map, while Muscle Profile is shown on the hypertrophy radar.
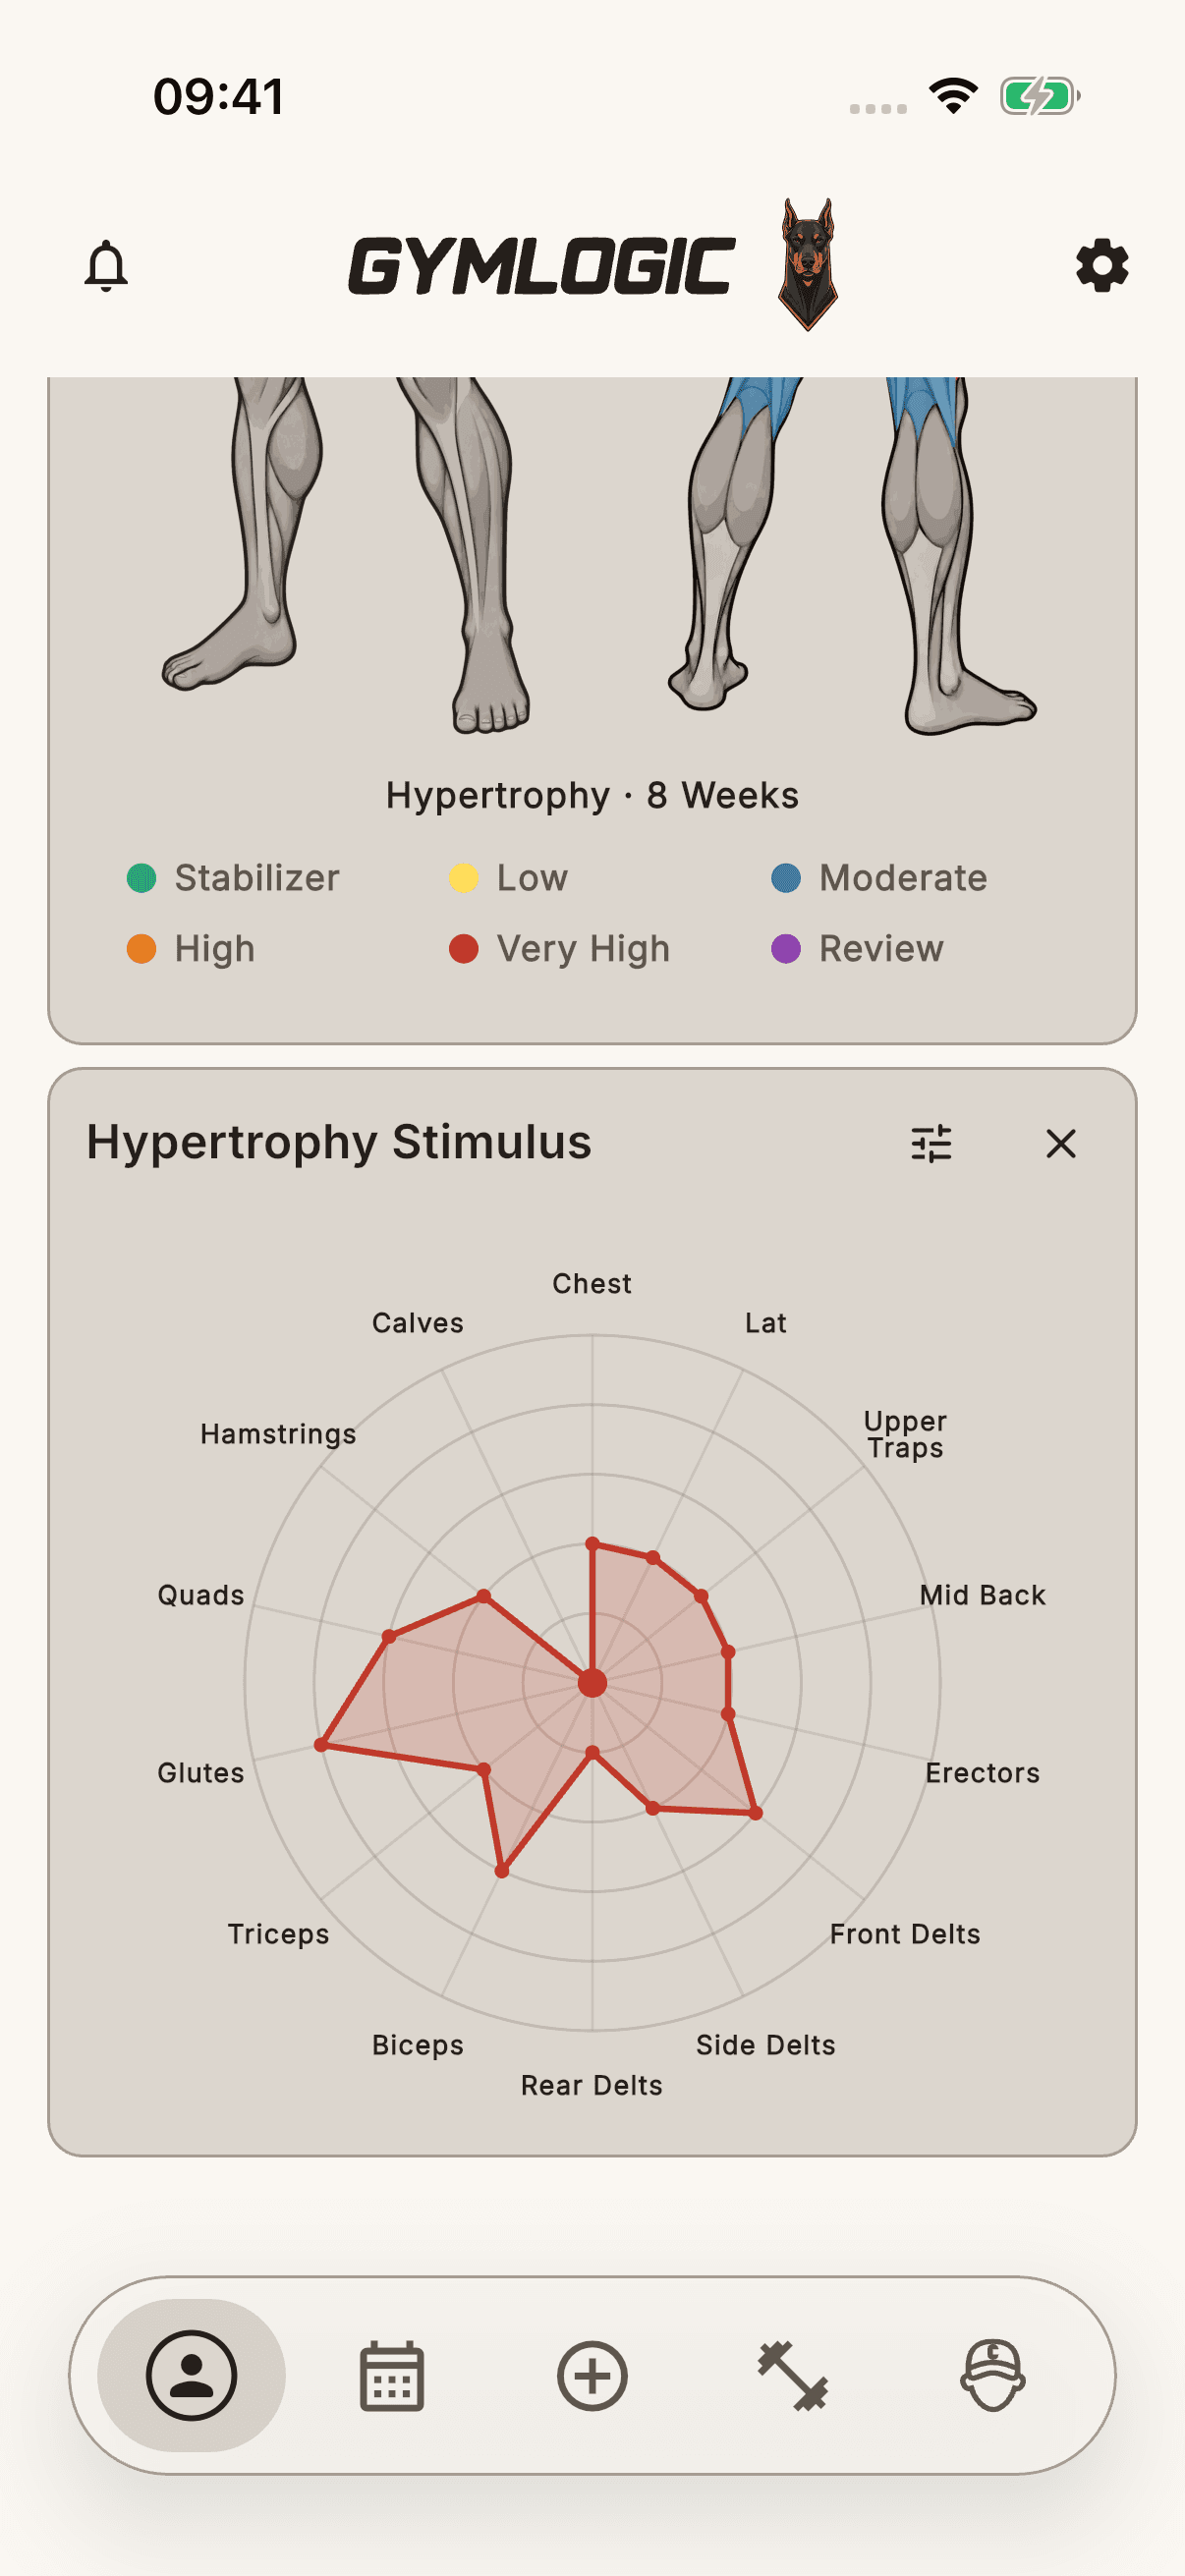
The settings icon on Hypertrophy Stimulus opens Set Hypertrophy Range. Apply your selected period with Save.
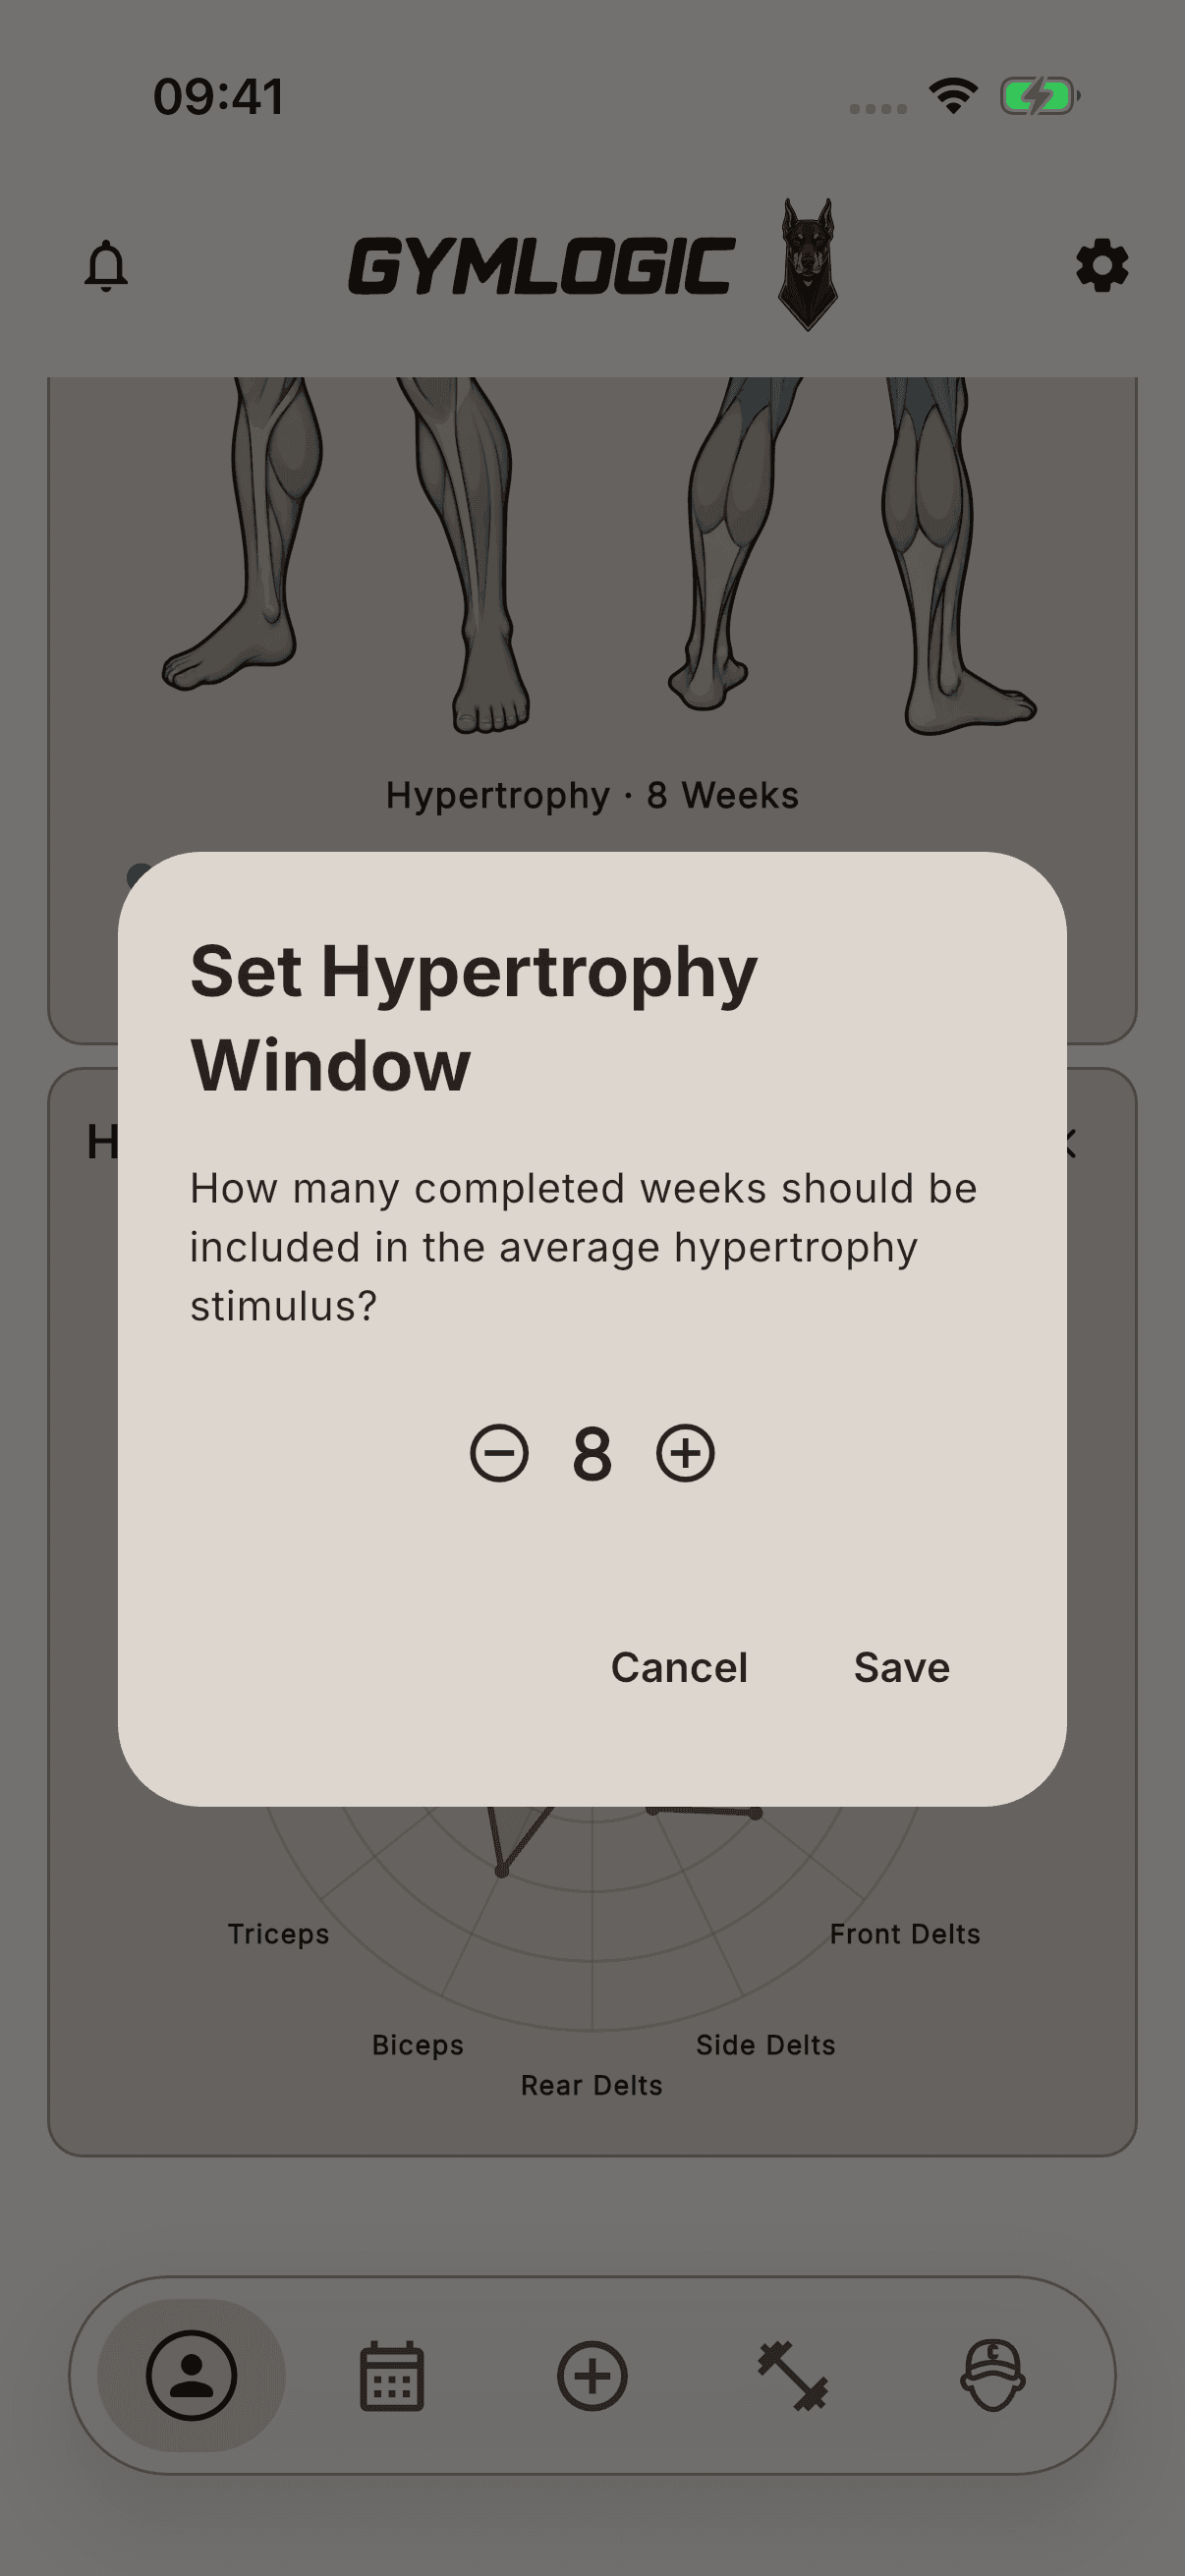
The long-term Muscle Profile view allows a 4–32-week window; the default is 8 weeks. Read completed, observable weeks alongside the number of weeks in which you trained. Do not confuse the current incomplete week with an average of completed weeks.
The radar and body colors show the product's volume/stimulus bands. A larger area does not directly mean stronger muscles or more muscle growth. Dividing areas such as the back into subgroups can produce different aggregation levels on different analytics screens.
Empty views or locks
No data, no current data, and an observed zero are separate states. Some details may require Pro access. Do not delete workout history because you see a lock or empty chart; check the period, records, and access status.